
Page 31 - SSSOID1920_11Sept
P. 31
SINGAPORE SHIPREPAIRING, SHIPBUILDING & OFFSHORE INDUSTRIES DIRECTORY 2019/2020
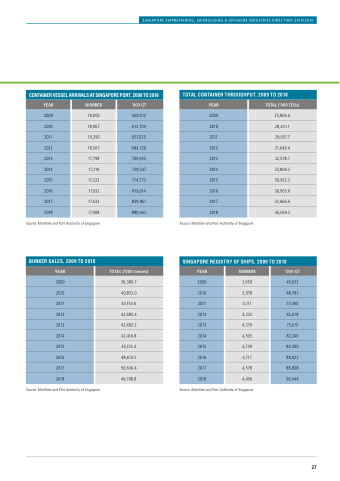
CONTAINER VESSEL ARRIVALS AT SINGAPORE PORT, 2009 TO 2018
YEAR
NUMBER
‘000 GT
2009
18,005
560,012
2010
18,967
613,709
2011
19,290
657,025
2012
18,567
684,720
2013
17,798
709,935
2014
17,219
739,547
2015
17,222
774,773
2016
17,932
819,014
2017
17,633
839,861
2018
17,908
880,963
TOTAL CONTAINER THROUGHPUT, 2009 TO 2018
YEAR
TOTAL (‘000 TEUs)
2009
25,866.6
2010
28,431.1
2011
29,937.7
2012
31,649.4
2013
32,578.7
2014
33,869.3
2015
30,922.3
2016
30,903.6
2017
33,666.6
2018
36,599.3
Source: Maritime and Port Authority of Singapore Source: Maritime and Port Authority of Singapore
BUNKER SALES, 2009 TO 2018
YEAR
TOTAL (‘000 tonnes)
2009
36,386.7
2010
40,853.0
2011
43,153.6
2012
42,685.4
2013
42,682.2
2014
42,416.8
2015
45,155.4
2016
48,614.5
2017
50,636.4
2018
49,798.8
SINGAPORE REGISTRY OF SHIPS, 2009 TO 2018
YEAR
NUMBER
‘000 GT
2009
3,950
45,632
2010
3,978
48,783
2011
4,111
57,360
2012
4,232
65,018
2013
4,379
73,615
2014
4,595
82,249
2015
4,739
86,300
2016
4,717
88,023
2017
4,578
88,808
2018
4,456
90,944
Source: Maritime and Port Authority of Singapore Source: Maritime and Port Authority of Singapore
27
