
Page 30 - SSOI 2021_RV1_04112020
P. 30
SINGAPORE SHIPREPAIRING, SHIPBUILDING & OFFSHORE INDUSTRIES DIRECTORY 2020/2021
SINGAPORE MARINE INDUSTRY STATISTICS
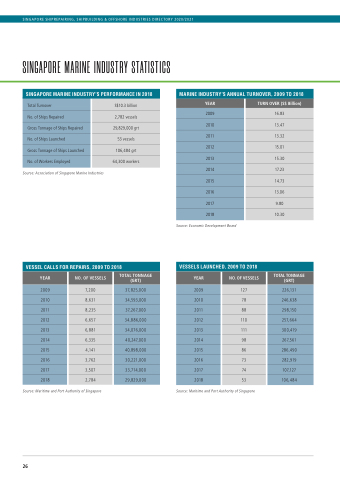
SINGAPORE MARINE INDUSTRY’S PERFORMANCE IN 2018
Total Turnover
S$10.3 billion
No. of Ships Repaired
2,782 vessels
Gross Tonnage of Ships Repaired
29,829,000 grt
No. of Ships Launched
53 vessels
Gross Tonnage of Ships Launched
106,484 grt
No. of Workers Employed
64,300 workers
MARINE INDUSTRY’S ANNUAL TURNOVER, 2009 TO 2018
YEAR
TURN OVER (S$ Billion)
2009
16.83
2010
13.47
2011
13.32
2012
15.01
2013
15.30
2014
17.23
2015
14.73
2016
13.06
2017
9.80
2018
10.30
Source: Association of Singapore Marine Industries
Source: Economic Development Board
VESSEL CALLS FOR REPAIRS, 2009 TO 2018
YEAR
NO. OF VESSELS
TOTAL TONNAGE (GRT)
2009
7,200
37,825,000
2010
8,631
34,593,000
2011
8,235
37,267,000
2012
6,657
34,886,000
2013
6,881
34,076,000
2014
6,335
40,247,000
2015
4,141
40,898,000
2016
3,762
30,221,000
2017
3,507
33,714,000
2018
2,784
29,829,000
VESSELS LAUNCHED, 2009 TO 2018
YEAR
NO. OF VESSELS
TOTAL TONNAGE (GRT)
2009
127
226,131
2010
78
246,638
2011
88
298,150
2012
110
257,664
2013
111
300,419
2014
98
267,561
2015
86
286,490
2016
73
282,919
2017
74
107,127
2018
53
106,484
Source: Maritime and Port Authority of Singapore Source: Maritime and Port Authority of Singapore
26
